Statistical Process Control (SPC)
In IFS Quality Management – Statistical Process Control, you can:
- Create
 ,
,
 , X &
MR, np, p,
c, and u control charts.
, X &
MR, np, p,
c, and u control charts.
- View and analyze control charts graphically.
Statistical Process Control (SPC) is a philosophy that emphasizes the use of statistical techniques,
such as control charts, in all areas of a company to make continuous improvements in
quality and productivity by reducing variation in processes.
SPC uses control charts to analyze
a process
or its outputs and take appropriate actions to achieve and maintain a state of
statistical control. A process is in
statistical control (“in control”) when all special causes of variation have
been eliminated and only common causes remain, i.e., observed variation can be attributed
to a constant system of chance causes. A process in statistical control can be described
by a predictable distribution.
Some of the important benefits of using SPC and the corresponding control
charts are:
- Control charts are effective tools to understand process variation and help achieve
statistical control. They provide reliable information on when action should
or should not be taken (over adjustment). The primary goal is defect prevention,
as opposed to defect detection.
- A process in statistical control is predictable. Thus producer and customer can rely on
consistent quality levels and stable cost to achieve that quality level.
- Control charts provide a common language for discussing the performance of processes.
- Control charts give a good indication whether any problems are likely to be
corrected locally or require management action, since they distinguish special causes
of variation from common causes.
Several statistical tests (alarm rules) can be used to determine whether a control chart is "in control". A predefined battery of alarm
rules has been implemented in IFS/Quality Management – Statistical
Process Control. One or more of these alarm rules can be activated. If an alarm
rule violation occurs for an activated alarm rule, information about the alarm
rule violation is displayed in the control chart window.
- Out of Specification: If selected, indicates you want to trigger an
alarm rule violation when any point in the control chart is above Inner Max
or Outer Max or below Inner Min or Outer Min.
- Above Upper Control Limit: If selected, indicates you want to
trigger an alarm rule violation when any point in the control chart is above
the Upper Control Limit (UCL).
- Below Lower Control Limit: If selected, indicates you want to
trigger an alarm rule violation when any point in the control chart is below
the Lower Control Limit (LCL).
- 2 out of 3 beyond 2 sigma: If selected, indicates you want to
trigger an alarm rule violation when at least two out of three successive
points in the control chart on the same side of the centerline (CL) are
beyond the 2 sigma limit.
- 4 out of 5 beyond 1 sigma: If selected, indicates you want to
trigger an alarm rule violation when at least four out of five successive
points in the control chart on the same side of the centerline (CL) are
beyond the 1 sigma limit.
- 15 at or within 1 sigma: If selected, indicates you want to trigger
an alarm rule violation when 15 successive points in the control chart are
at or within 1 sigma.
- 8 outside 2 sigma: If selected, indicates you want to trigger an
alarm rule violation when eight successive points in the control chart are
outside +2 or -2 sigma.
- 8 below or above the centerline: If selected, indicates you want to
trigger an alarm rule violation when eight successive points in the control
chart are below or above the centerline.
- Runs up/down of length 8 or greater: If selected, indicates you
want to trigger an alarm rule violation when eight successive points in the
control chart are in ascending or descending order.
If any of these alarm rules are violated, corrective action should be
considered.
There are numerous types of control charts that can be used for different
situations. The picture below describes the most commonly used control charts and when to use them:
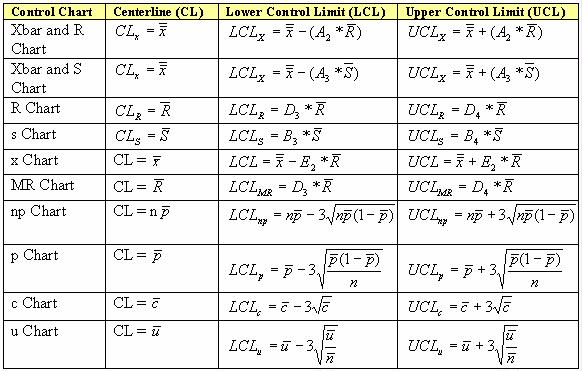
The formulas used to calculate these different types of Control Charts are:
The values for the constants A2, A3, D3, D4, B3,
B4 and E2 can be found in any Statistical Table. n =sample size, p =
(number of defective in sample) / (number of items in sample), n  (sample size)*((total number of defective samples) /
(total number of samples)), c = number of defects counted in a sample, u = (number of
defects counted in a sample) / (number of items in a sample).
(sample size)*((total number of defective samples) /
(total number of samples)), c = number of defects counted in a sample, u = (number of
defects counted in a sample) / (number of items in a sample).
Control charts are typically displayed graphically.